This project was developed using datasets taken from
Our World In Data
and
The American Association For The Advancement Of Science.
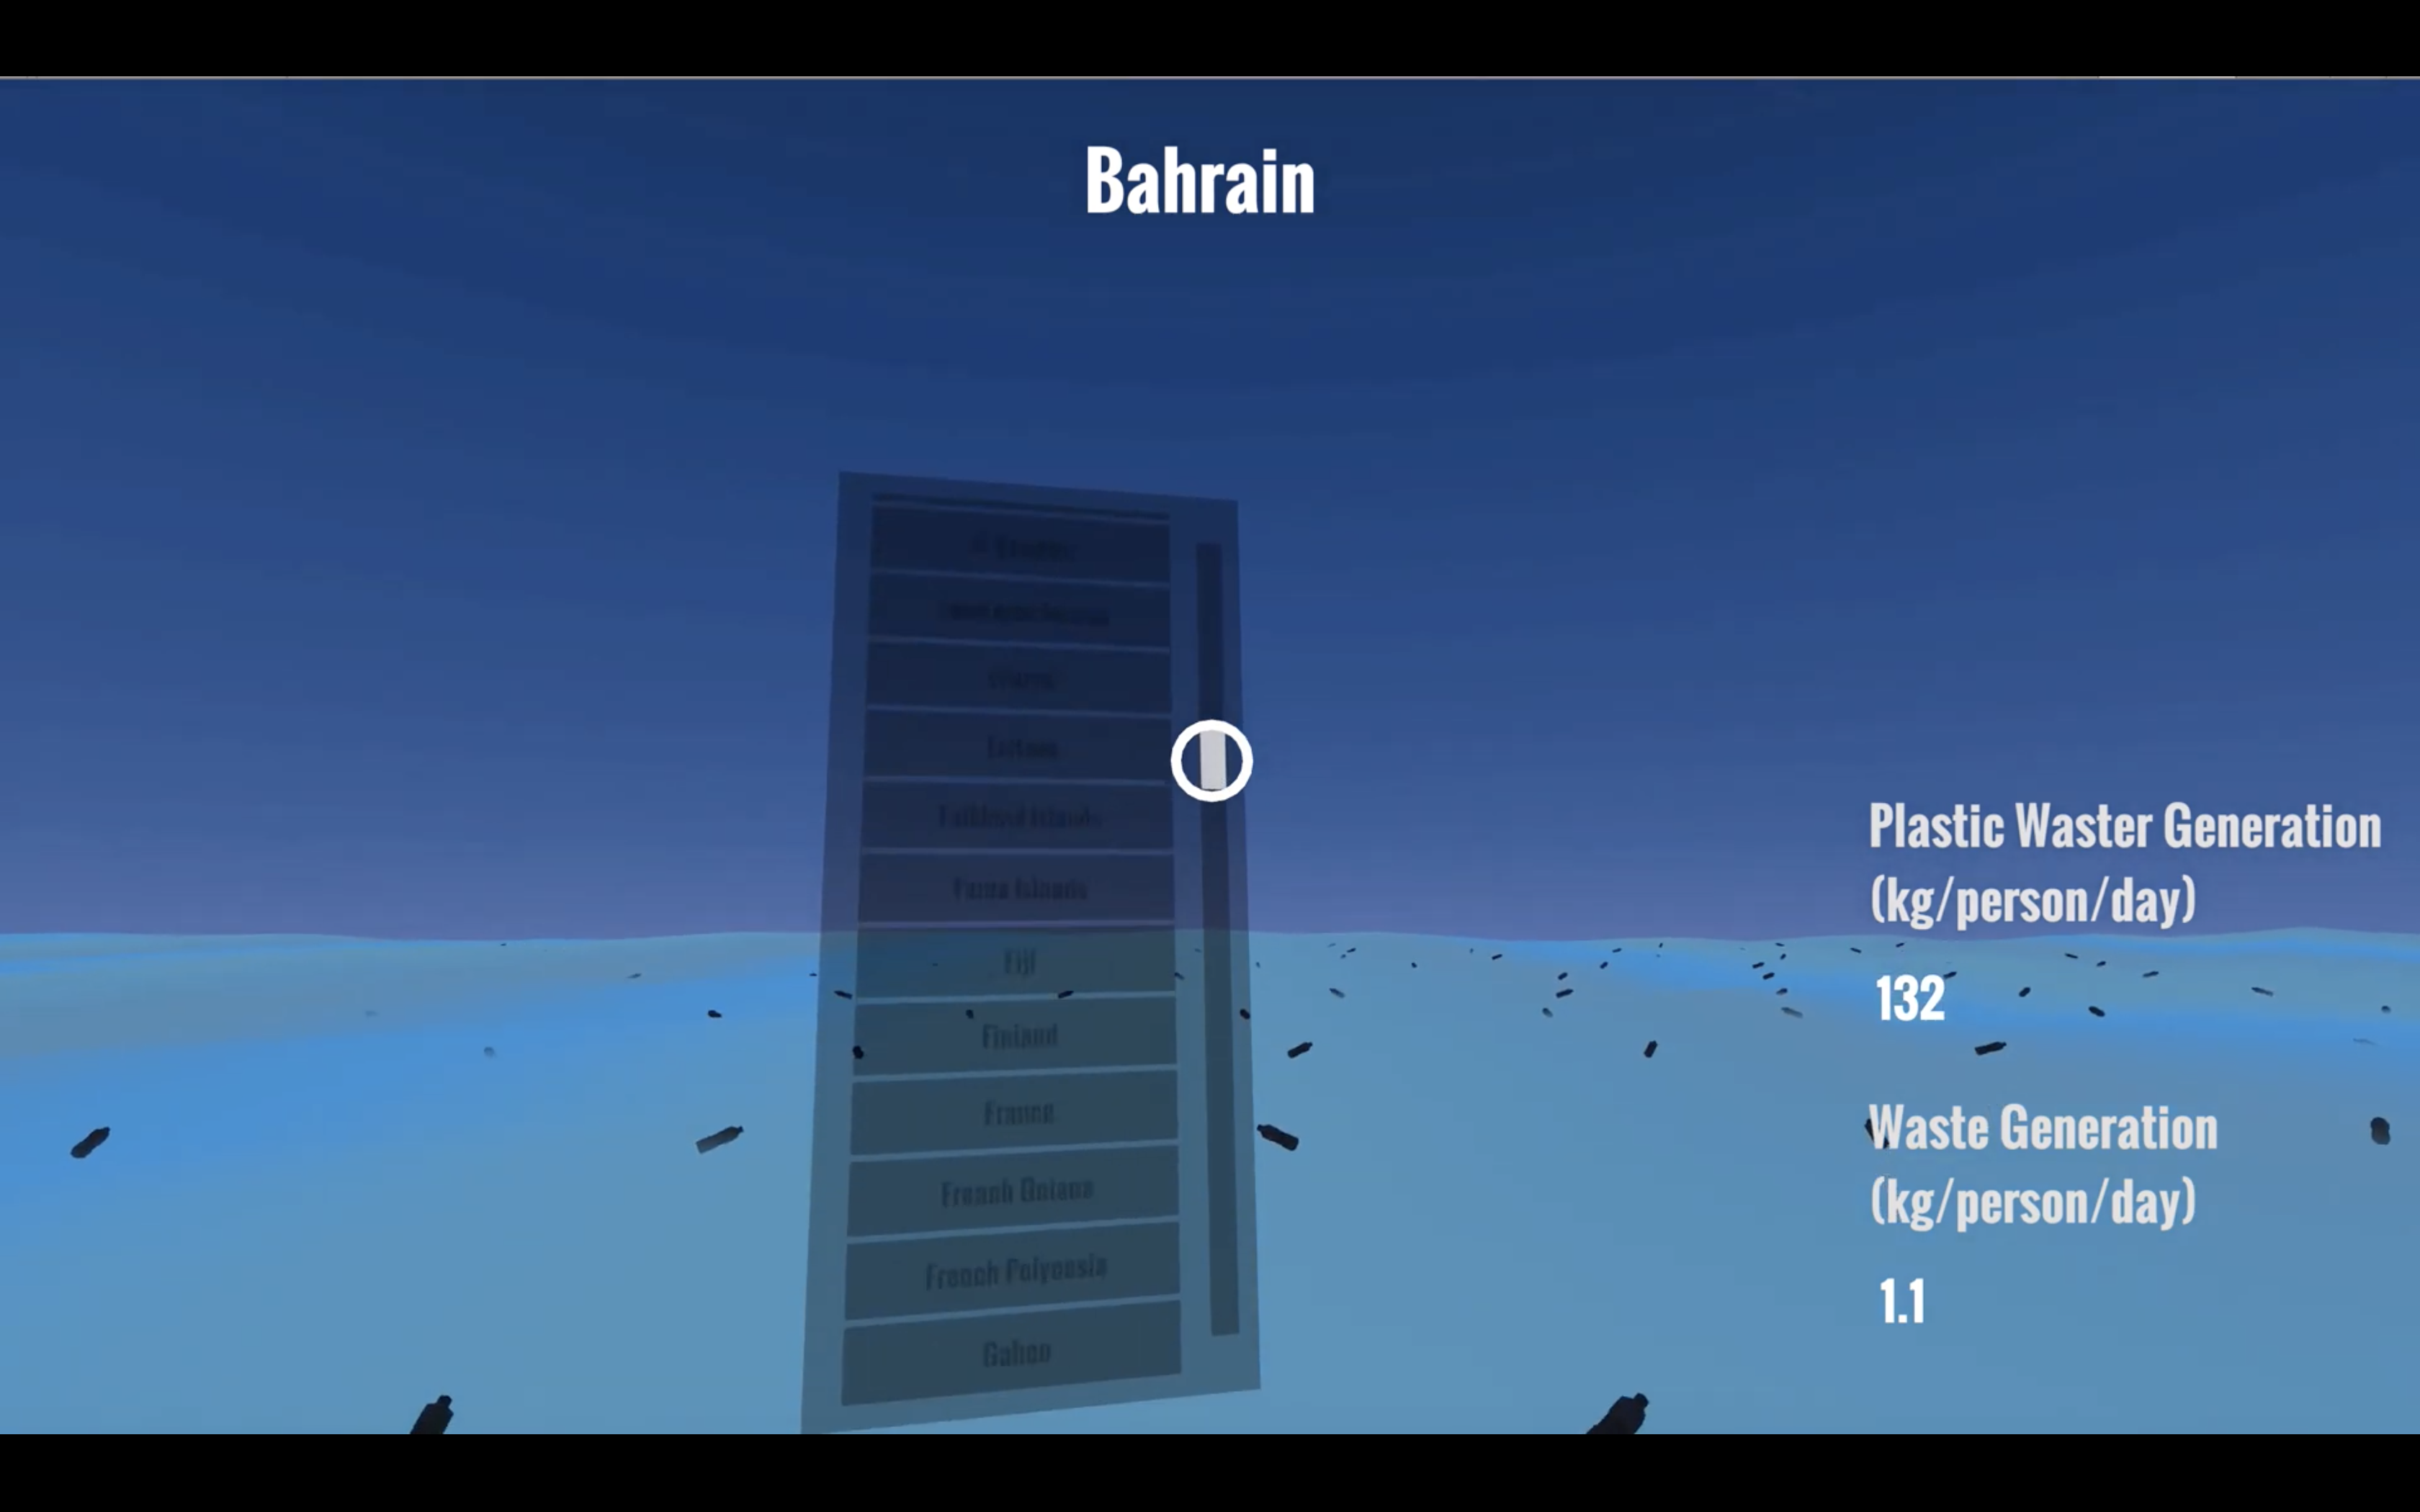
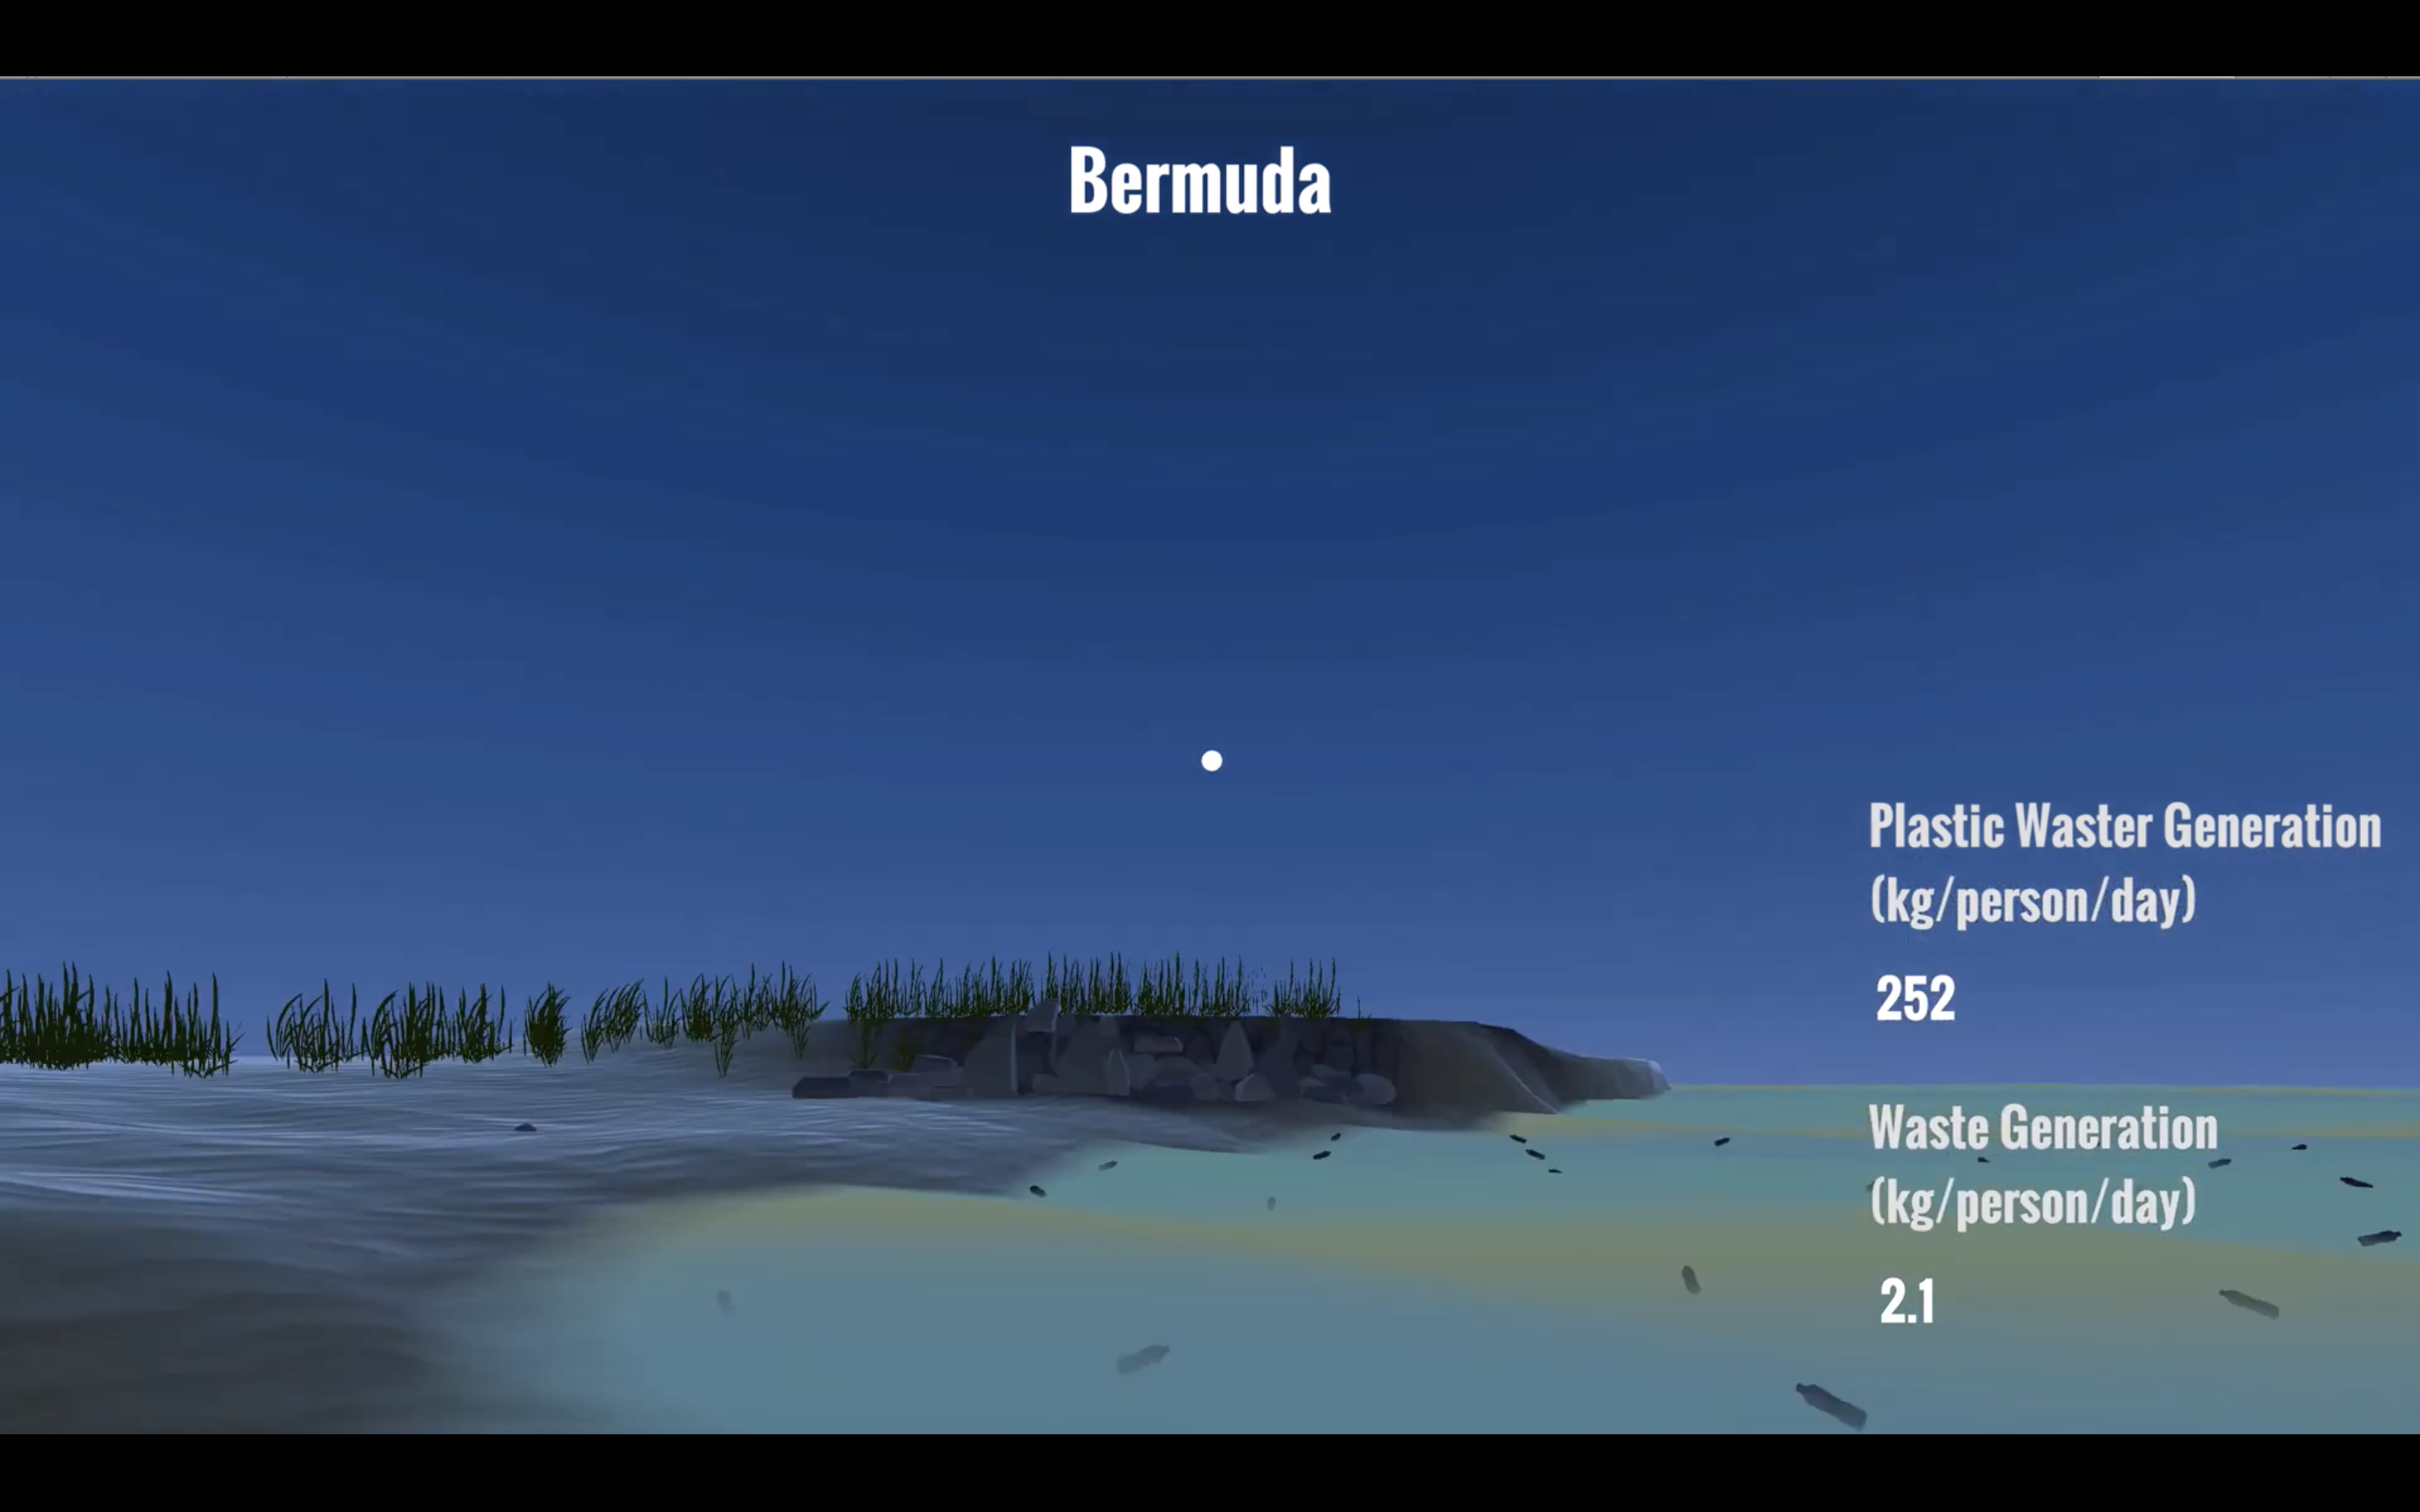
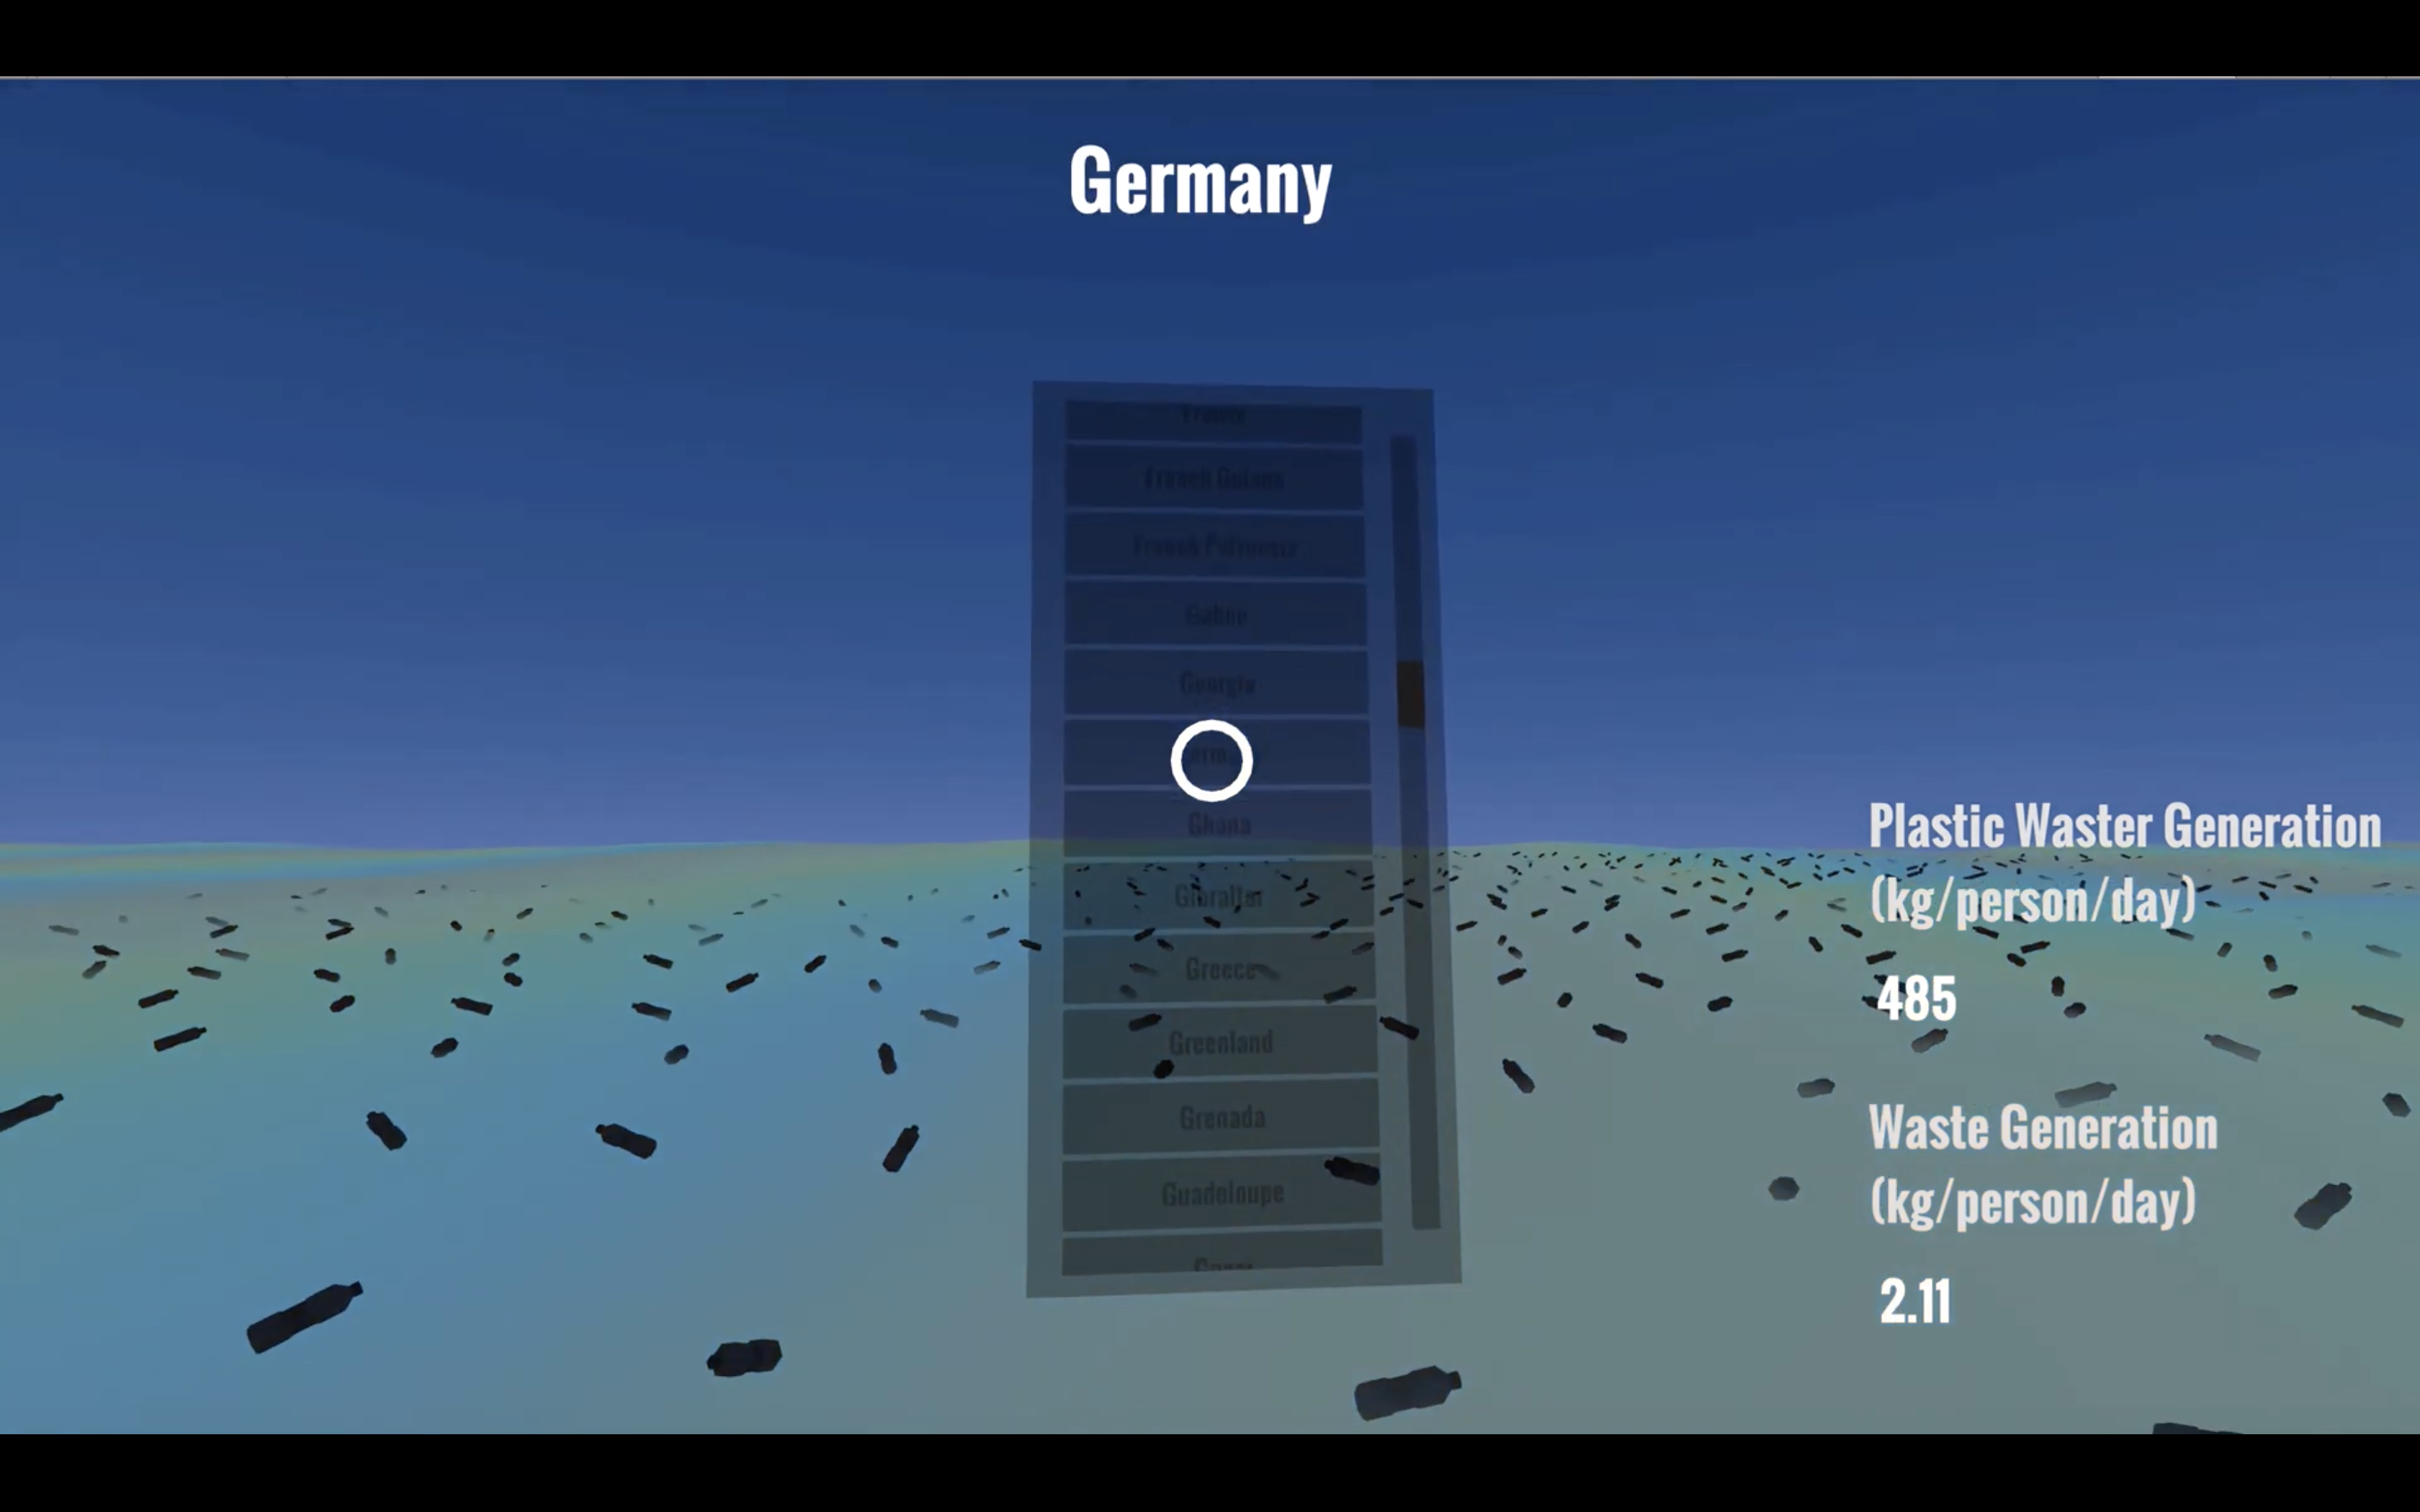
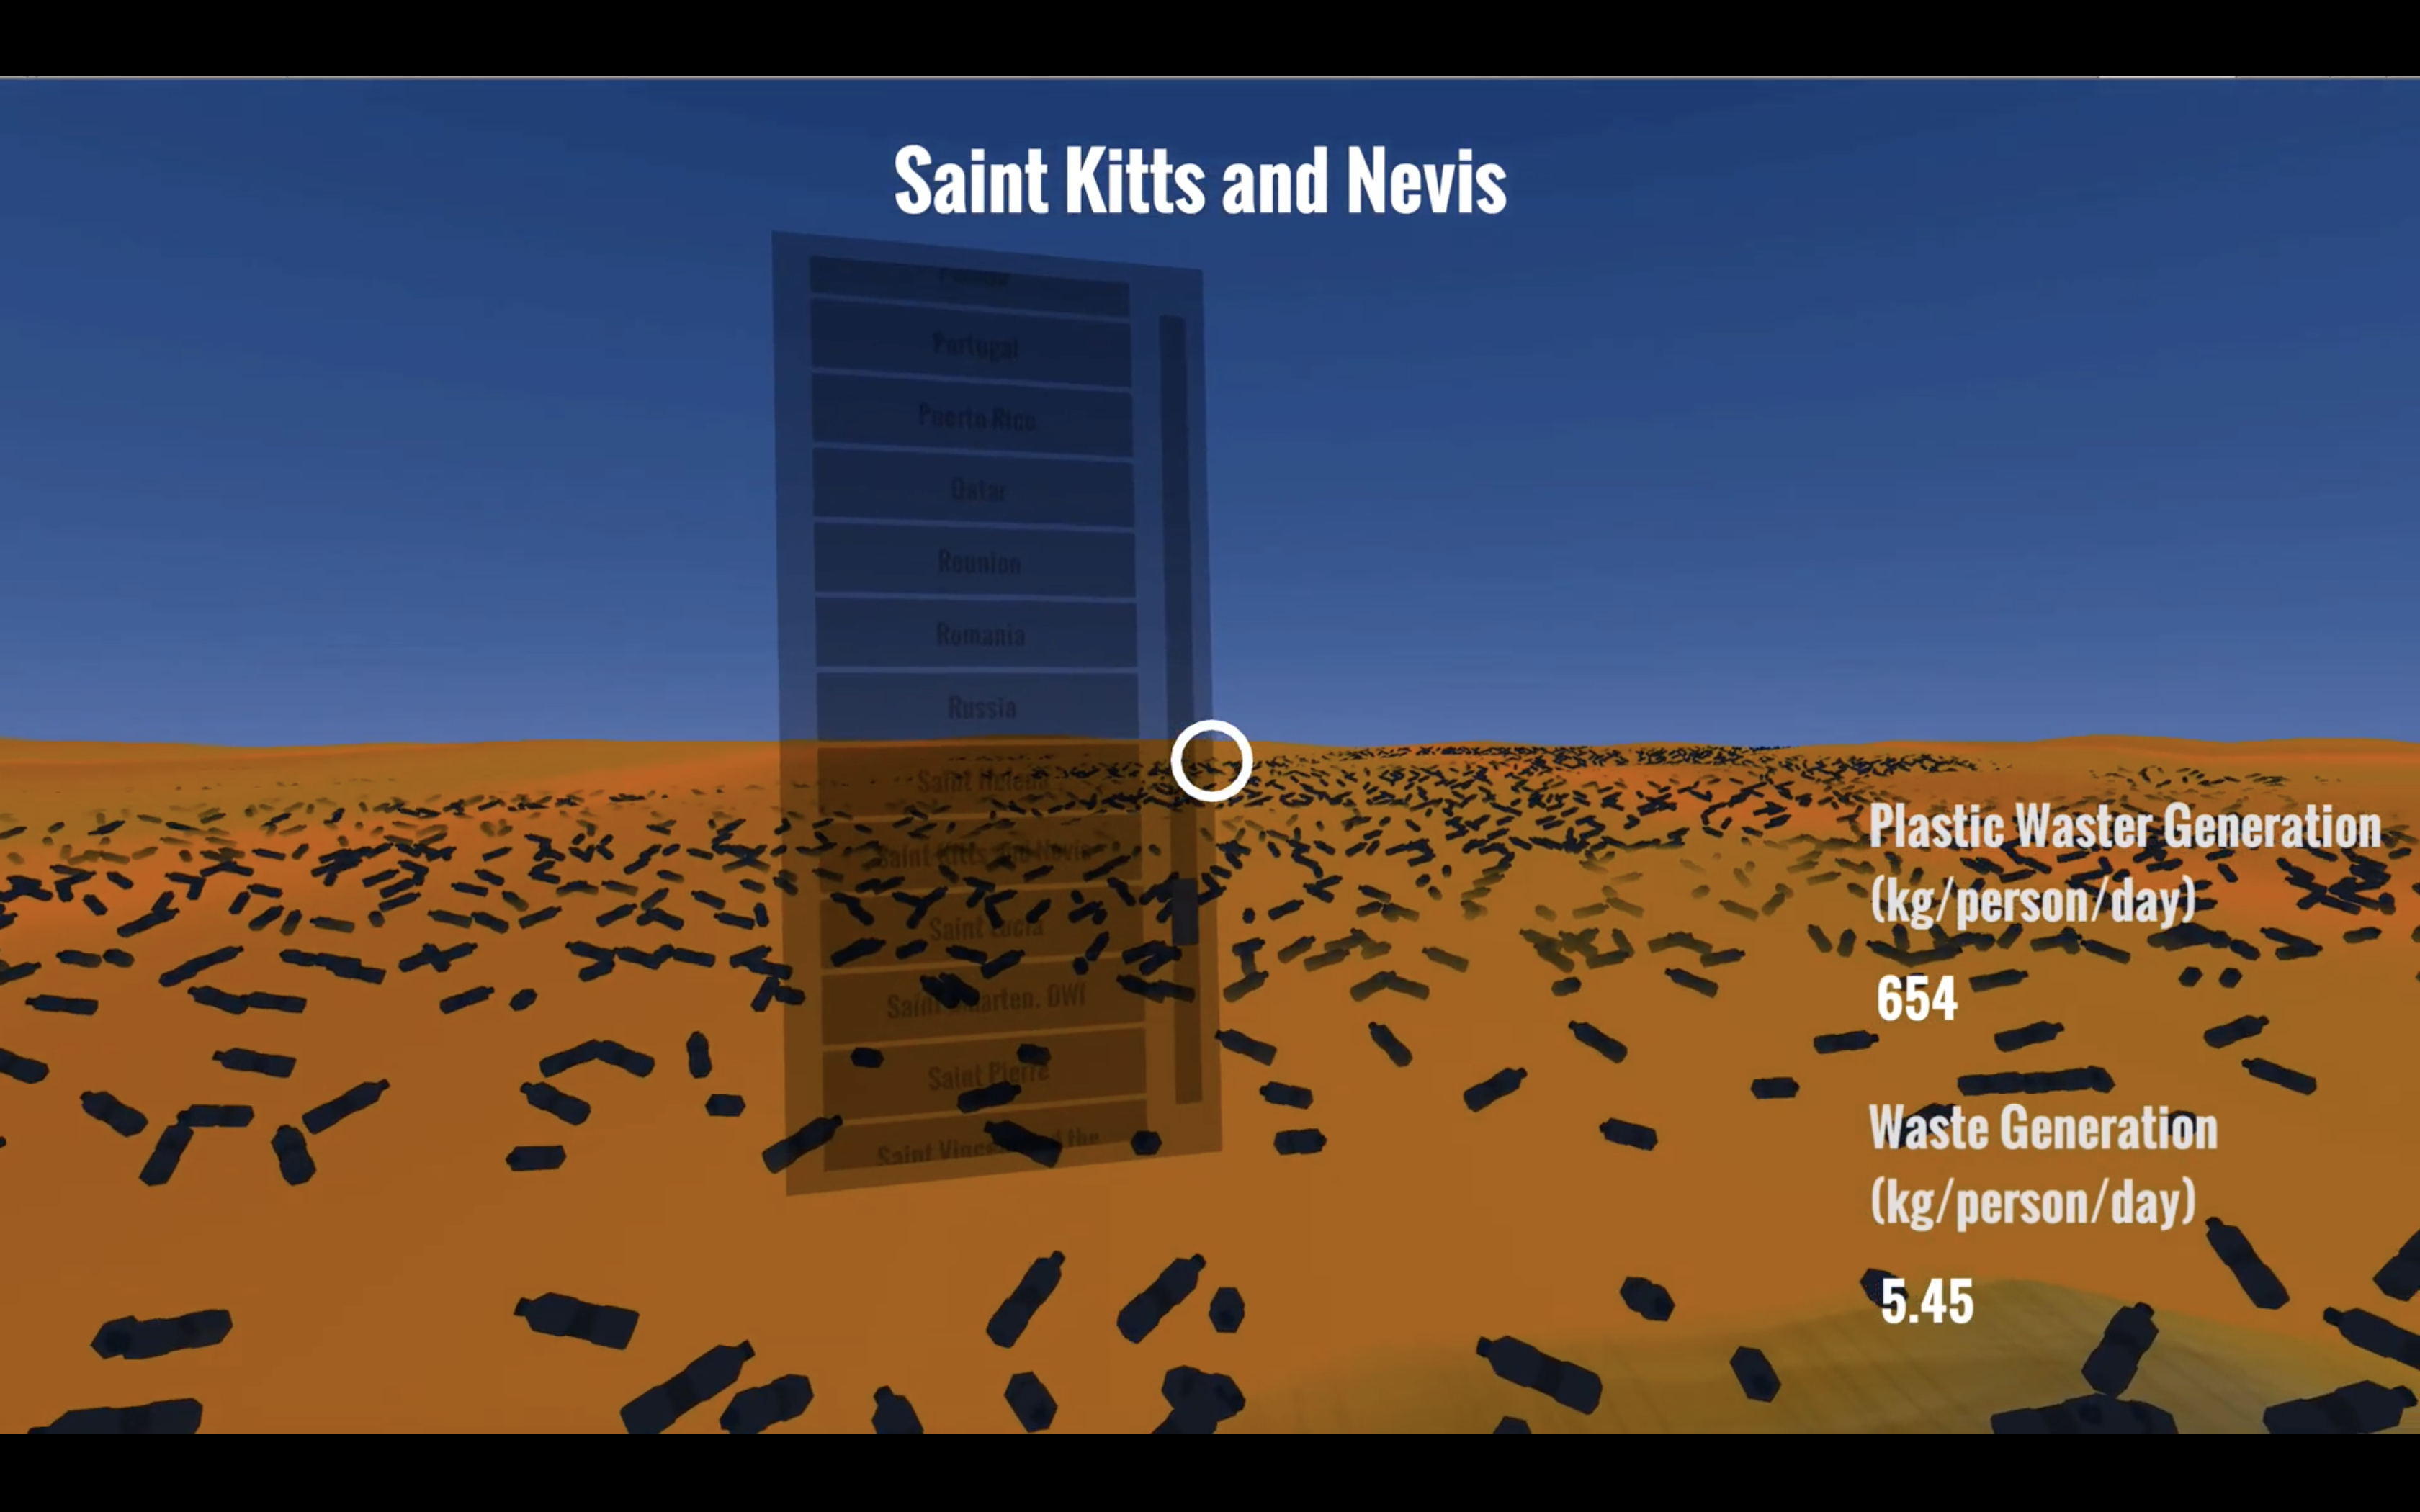
This data was then mapped for each country to determine how
"dirty" the ocean water would be as well as the number of bottles
that would be in the water. The data from Our World In Data was
used for the plastic waste per capita, which was mapped to the
number of plastic bottles floating in the water. The other data
set was used for the waste generation rate for water pollution. I
mapped this value to a shader and used it as a material for a
water asset that Unity provided.
This was also a project that aimed to experiment with the use of
the Google Cardboard as a way to design VR experiences. The Google
Cardboard is quite limited in its options for interaction, only
allowing looking and clicking with the top button. I wanted users
to be able to directly understand the data for ocean pollution in
a visual, immersive way, but this required me to think about how
they could interact with the data with the Cardboard. My solution
to this was to design a UI component with an intuitive scrollbar
that users could move to sort the list of nations in alphabetical
order. The user could look to a part of the scrollbar (which would
be highlighted when the reticle was on it) and press the button on
the Cardboard to pan the scrollbar to that location. The opacity
of the UI element is lowered when the user was viewing the
environment. This was done so the user is aware of the presense of
the controls and their ability to view the data of other countries
but not distracting enough for the user to lose focus on the
environment.
I also designed a simple scene with a jetty and some grass in
order to make the environment more realistic but also contrasting
with the surreal visuals that are presented. Another objective of
this project was to visualize this data in an engaging way. I
thought that mapping the number of bottles in the ocean to plastic
waste would be an effective way to visualize the quantities of
waste. The shader used for the ocean water was designed to be
psychedelic but also use colors that were commonly associated with
cleanliness (pristine blue/green) and dirtiness (brown)
It should be noted that the dataset seemed incomplete, with
many nations sharing the same values.